Quick answer
A perceptual map is a visual representation of how a selected customer group perceives competing brands, products or services on important dimensions. A simple map uses two attributes as axes and plots relative positions. Research-led maps can derive dimensions statistically from customer ratings. The map helps diagnose crowded positions, differences and possible gaps, but an empty space is not automatically a valuable opportunity.
Start here: How to build a perceptual map · Worked example · Original sources
Explore this guide
What is a perceptual map?
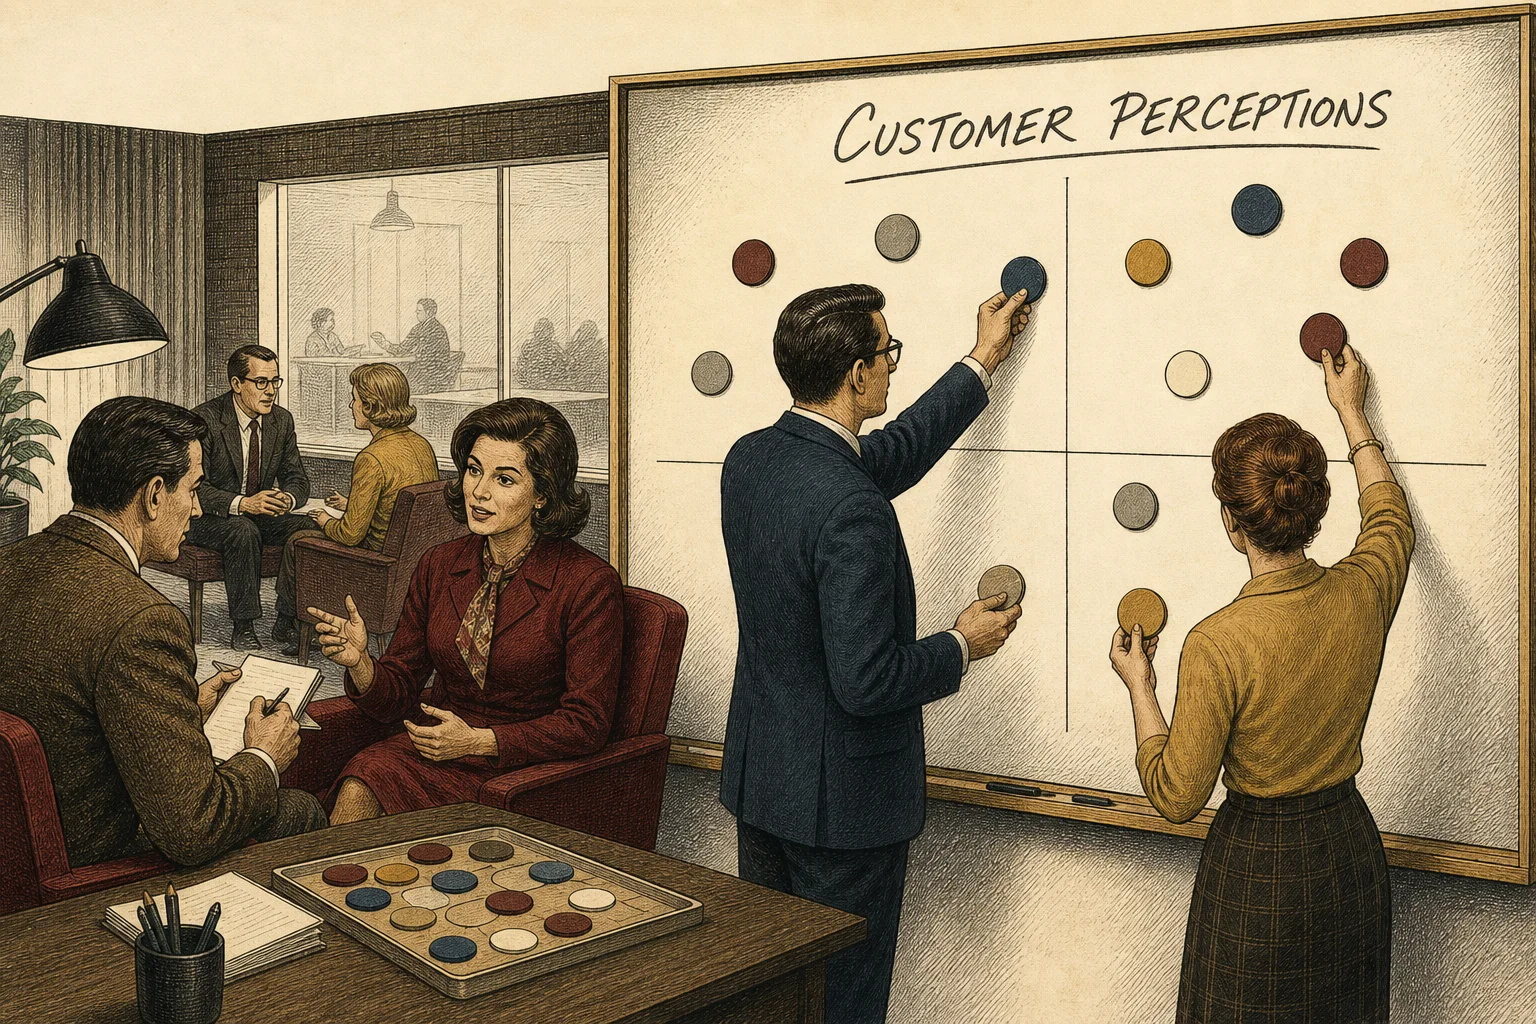
A perceptual map visualizes how customers see competing offers relative to one another. Each point represents the perceived position of a brand, product or service on dimensions that matter in the chosen market. Nearby points are perceived as more similar on those dimensions; distant points are perceived as more different.
The word perceptual is essential. A map of objectively measured horsepower, price or sugar content is a product map. It can be useful, but it does not show what customers believe unless those beliefs match the specifications. A true perceptual map is built from customer judgments, associations or similarity data.
Perceptions depend on the audience and context. New buyers may see a market differently from experts. Enterprise buyers may use different criteria from small businesses. A map should therefore name its segment, geography, occasion and research date rather than presenting one permanent view of the category.
What perceptual mapping can reveal
Maps make competitive structure easier to discuss. Teams can see which brands occupy similar positions, which dimensions separate leaders, whether a desired association is already owned and how the organization's perceived position differs from its intended position.
Adding preference data makes the map more useful. An ideal point or preference cluster shows where selected customers would like an offer to sit. Consideration, purchase or market share can be represented through color or bubble size. These layers prevent teams from interpreting every empty quadrant as demand.
Repeated maps can track repositioning, category change or segment differences. If a communication campaign is intended to move one association, pre- and post-campaign research can test whether perception shifted, though the design must distinguish campaign exposure from broader market effects.
How to read a two-axis positioning map
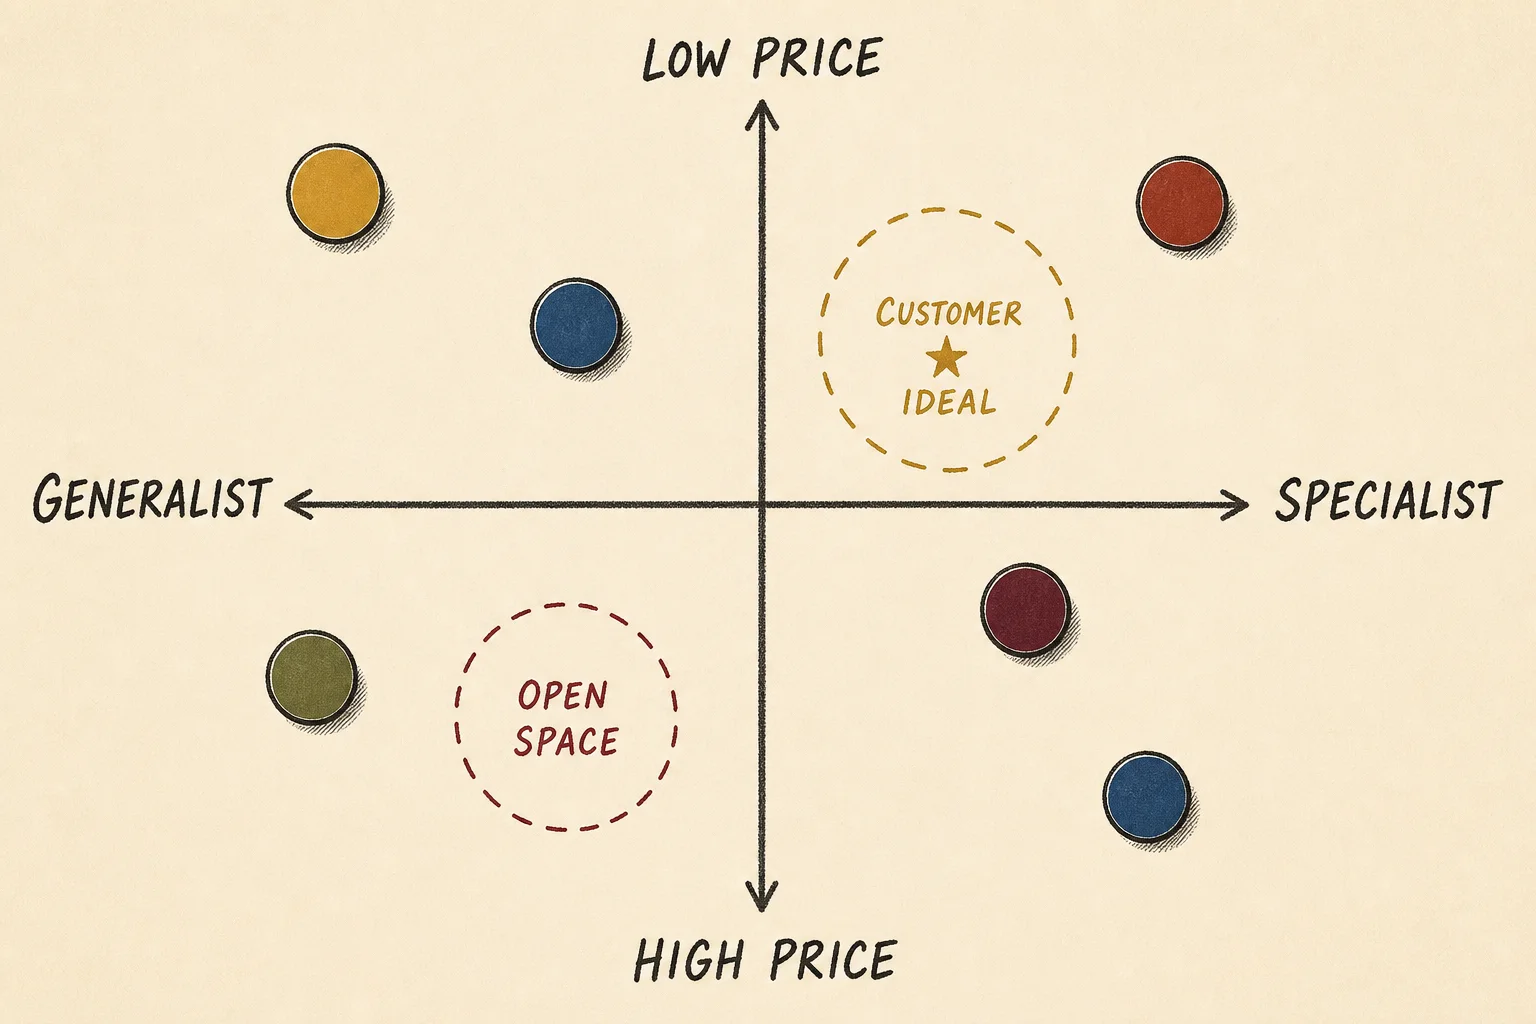
A simple map uses one dimension horizontally and another vertically. The endpoints should be clear opposites or meaningful ranges, such as generalist to specialist and lower to higher perceived price. Brand points are located using customer scores on each dimension.
Distance indicates perceived separation only within the chosen dimensions. A brand can appear close to another on price and specialization while differing sharply on design or distribution. The axes simplify a richer market, so the title, audience, sample and omitted dimensions should accompany the chart.
An open space is an unoccupied location on the map. A customer ideal is a desired location based on preference research. They are not the same. The strongest opportunities occur when meaningful preference, feasible delivery and credible differentiation overlap.
How to build a perceptual map
Start with the decision the map will support, then gather the evidence in sequence. A quick workshop map can generate hypotheses, but it should be labeled as an assumption map until customer data replaces the guesses.
Define the decision
Specify the customer, category, occasion and strategic question the map must illuminate.
- Whose perceptions matter?
- Which alternatives enter their choice?
- What decision will the map support?
Discover attributes
Learn the language and criteria customers use to describe, compare and choose among alternatives.
- Which attributes influence choice?
- How do customers express them?
- Which dimensions discriminate among brands?
Collect perception data
Measure how the selected audience rates or associates each relevant brand on the chosen attributes.
- Is the sample the intended target?
- Are brands familiar enough to rate?
- Are scales consistent and unbiased?
Build the map
Plot brands on selected or statistically derived dimensions while documenting the method.
- Do the axes explain meaningful differences?
- Are distances interpretable?
- Is uncertainty visible?
Interpret and act
Connect positions and preference to a feasible product, brand or communication decision.
- Where is competition dense?
- Which positions customers prefer?
- Can the organization credibly move or enter?
Choose axes that matter to customers
Do not default to price and quality simply because they are familiar. Quality is often a bundle of reliability, design, service and performance, and respondents may interpret it inconsistently. Discover the decision criteria customers naturally use, then test which ones separate alternatives and influence preference.
Qualitative research is useful before the survey. Ask customers to compare recent choices, explain why two brands feel similar or different and describe the trade-offs they made. Reviews and sales conversations can reveal language, but they may overrepresent extreme experiences or late-stage objections.
For a managerial two-axis map, select dimensions that are strategically meaningful and not redundant. For a research-led map, collect ratings across several attributes and use techniques such as factor analysis or multidimensional scaling to derive dimensions. Statistical extraction still requires judgment when naming and interpreting the axes.
Collect and analyze perception data
Recruit respondents from the relevant target and screen for category or brand familiarity. Asking people to rate brands they do not know creates noise. Use consistent scales, randomize where appropriate and avoid attribute wording that contains the desired conclusion.
Direct attribute ratings ask respondents to score each brand on known criteria. Similarity judgments ask which brands feel alike and can support multidimensional scaling. Correspondence analysis can map associations from categorical data. The right method depends on the decision, data and analytical skill available.
Plot averages carefully. A single mean can hide polarized perceptions or distinct segments. Examine distributions and build separate maps when groups use different criteria or perceive the same brands differently. Show sample size and uncertainty when decisions are high stakes.
Perceptual map example: commuter backpacks
The example connects the map to the same repairable-backpack position used elsewhere in the Chronology. It shows why preference and feasibility must accompany the visual gap.
A repairable-backpack company wants to understand an everyday bag market. Interviews suggest two decision dimensions: perceived price and whether the bag feels general-purpose or designed for specialist commuter needs.
Survey daily laptop commuters who bought or considered an everyday backpack in the past year. Include the brands and non-brand alternatives they actually recognize.
Measure several attributes first, including price, durability, repairability, technical specialization, style and ease of purchase. Use the data to test whether price and generalist-to-specialist are meaningful summaries.
Plot average customer ratings, not manufacturer specifications. Add consideration or preference so the team can distinguish an empty location from a desired location.
A specialist, mid-to-high-price area has strong commuter preference but no brand associated with visible repairability. This becomes a positioning hypothesis, not an automatic launch decision.
Test whether modular construction can deliver the expected reliability, whether buyers accept the price and whether the company can teach repairability without confusing the category.
The map reveals a possible opening. Product feasibility, market size, profitability and proof still determine whether the opening is strategically attractive.
How to interpret gaps without fooling yourself
A gap can be empty because customers do not want the combination, because it is technically difficult, because the economics are poor or because category expectations make it hard to believe. Treat open space as a research question rather than a recommendation.
Look at movement costs. A brand already known as inexpensive and general-purpose may not credibly become premium and specialist through communication alone. Product, price, channel, service and evidence may need to change. Existing associations can be assets or constraints.
Consider competitor reaction. An attractive position may not stay empty after entry. The organization needs capabilities and distinctive assets that make the position defensible, not only a dot placed where no competitor currently appears.
- The map names the audience, category, place and date.
- The competitive set reflects real customer alternatives.
- Axes are based on customer language or validated dimensions.
- Brand locations come from perception data.
- Preference is separated from empty space.
- Segment differences and uncertainty are examined.
- Any proposed move is supported by product, experience and proof.
Common perceptual-mapping mistakes
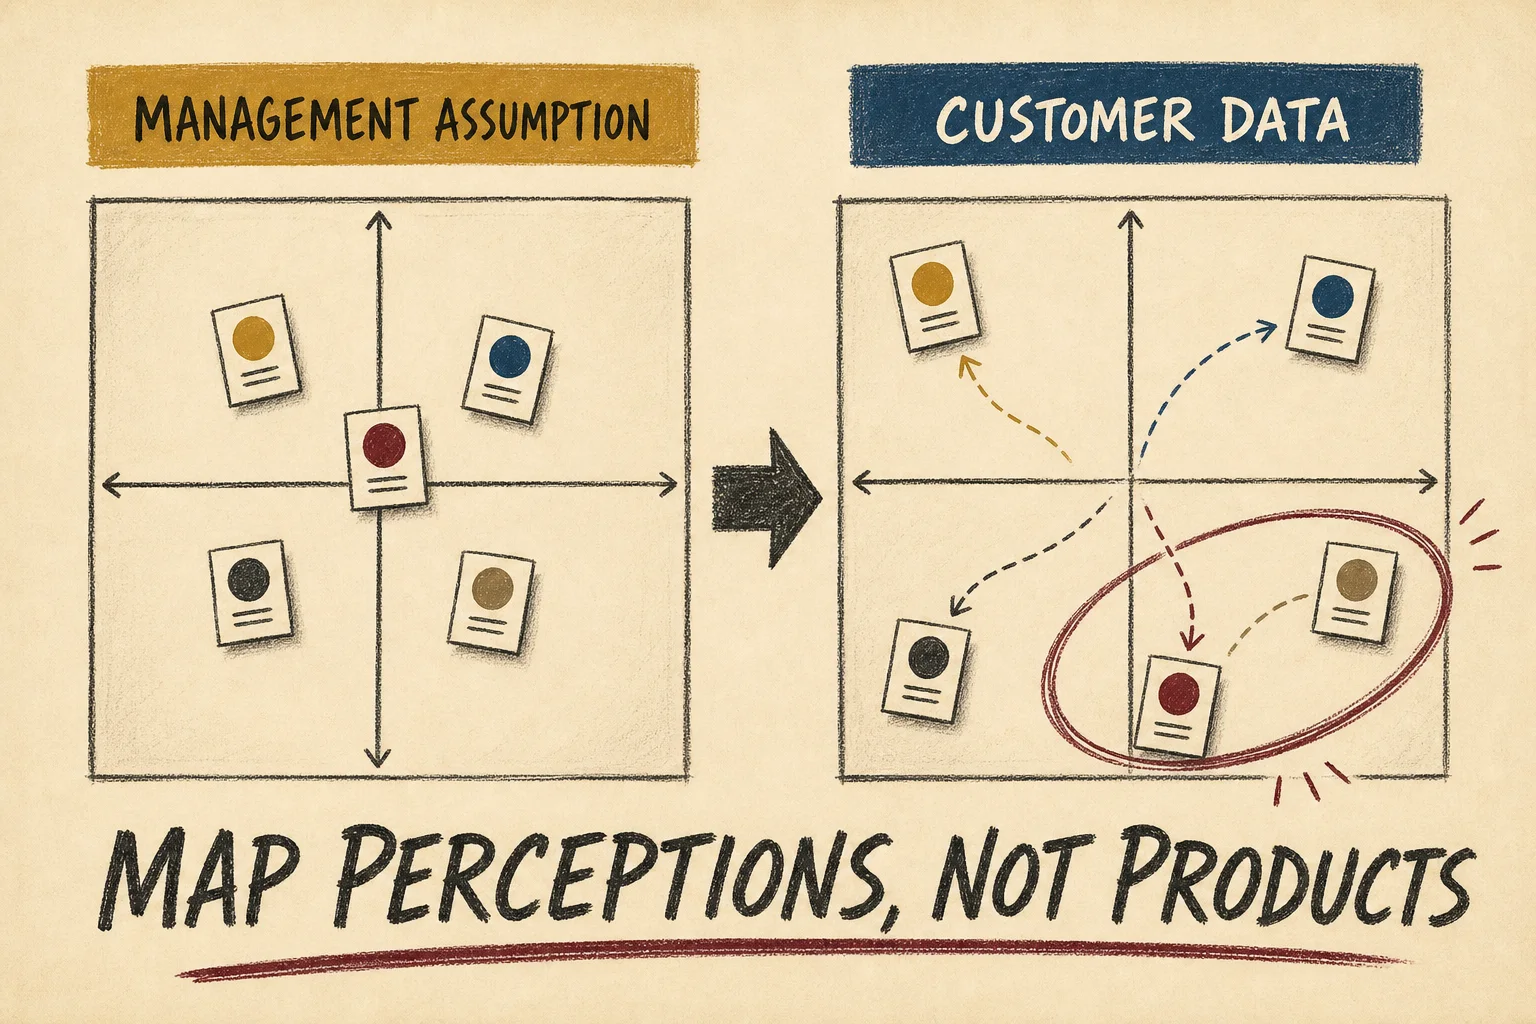
The most common mistake is asking executives to place brands and presenting the result as market research. An internal map can align hypotheses, but it represents management perception until tested with customers.
Another mistake is choosing flattering axes. A brand can look uniquely strong when the team selects dimensions built around its features. The map should use attributes customers recognize and value, including dimensions on which the brand performs poorly.
Finally, teams can overread two dimensions. A clean visual encourages confident stories, but the category may depend on many attributes and situations. Use the map as a decision aid alongside interviews, economics, competitive analysis and product evidence.
Map what customers perceive, show what they prefer, and investigate why a space is empty before calling it an opportunity.
Frequently asked questions
What is a perceptual map in marketing?
It is a visual map of how a chosen customer group perceives competing brands or products relative to one another on important dimensions.
What is the difference between a perceptual map and a positioning map?
The terms are often used interchangeably. Perceptual map emphasizes measured customer perception, while positioning map is sometimes used more broadly for strategic or assumption-based plots.
How do you choose perceptual-map axes?
Discover attributes customers use to compare and choose, then select two meaningful, discriminating dimensions or derive dimensions statistically from broader perception data.
Does an empty space on a perceptual map mean an opportunity?
No. The space may be unwanted, infeasible, unprofitable or difficult to believe. Preference, market size, capability, economics and competitive response must also be tested.
Can perceptual maps compare customer segments?
Yes. Separate maps can show how segments perceive brands or value attributes differently, provided each segment has enough relevant respondents for a reliable comparison.
Sources and further reading
- OpenStax: Product Positioning and Perceptual Positioning Maps ↗Open textbook explanation of determinant attributes and two-axis perceptual maps
- Monash Business School: Perceptual Mapping ↗University definition emphasizing the perceptions of selected target-market individuals
- AQA: Teaching Guide to Market Mapping ↗Guidance connecting market analysis, target choice and relative product positioning
- Wiley Encyclopedia of Management: Perceptual Mapping ↗Reference overview of perceptual mapping and competitive interpretation